Haryana State Board HBSE 10th Class Maths Solutions Chapter 14 Statistics Ex 14.1 Textbook Exercise Questions and Answers.
Haryana Board 10th Class Maths Solutions Chapter 14 Statistics Ex 14.1
Question 1.
A survey was conducted by a group of students as a part of their environment awareness programme, in which they collected the following data regarding the number of plants in 20 houses in a locality. Find the mean number of plants per house.

Which method did you use for finding the mean, and why ?
Solution:
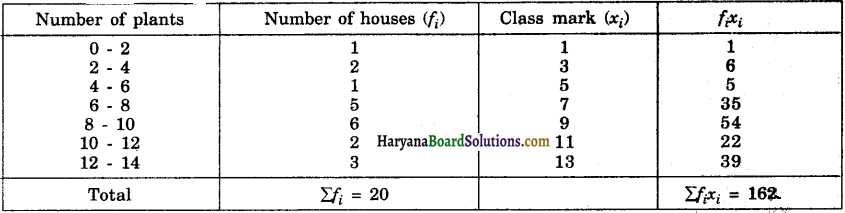
From the table, we have Σfi = 20, Σfixi = 162
∴ \(\bar{x}=\frac{\Sigma f_i x_i}{\Sigma f_i}\)
\(\bar{x}\) = \(\frac{162}{20}\) = 8.1
Hence, mean number of plants per house = 8.1 plants.
We used direct method to find the mean because numerical values of fi‘s and xi‘s were small.
![]()
Question 2.
Consider the following distribution of daily wages of 50 workers of a factory.
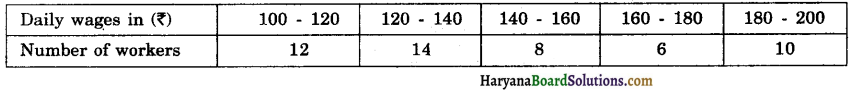
Find the mean daily wages of the workers of the factory by using an appropriate method.
Solution :
Here, h = 20
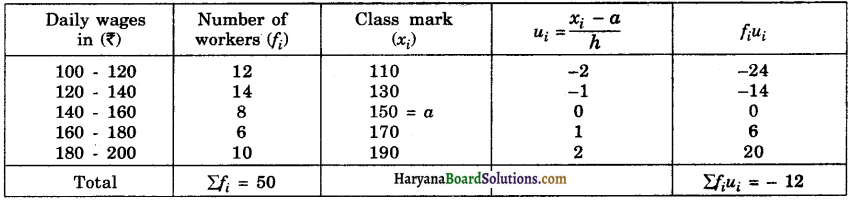
From the table, we have
Σfi = 50, Σfiui = – 12, a = 150, h = 20
∴ \(\bar{x}=a+\left(\frac{\Sigma f_i u_i}{\Sigma f_i}\right) \times h\)
⇒ \(\bar{x}=150+\left(-\frac{12}{50}\right) \times 20\)
⇒ \(\bar{x}\) = 150 – 4.80
⇒ \(\bar{x}\) = 145.20.
Hence, the mean daily wages of the workers = ₹ 145.20.
Question 3.
The following distribution shows the daily pocket allowance of children of a locality. The mean pocket allowance is ₹ 18. Find the missing frequency f.
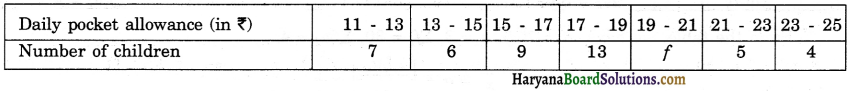
Solution :
Here, h = 2
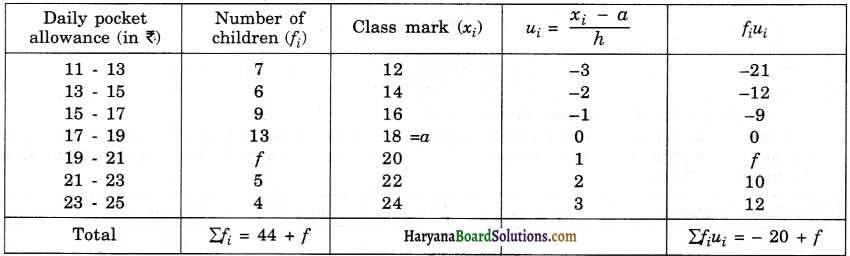
From the table, we have
a = 18, h = 2, Σfi = 44 + Σfiui = – 20 + f and mean (\(\bar{x}\)) = ₹ 18
\(\bar{x}\) = a + \(\left(\frac{\Sigma f_i u_i}{\Sigma f_i}\right)\) × h
18 = 18 + \(\left(\frac{-20+f}{44+f}\right)\) × 2
0 = \(\frac{-40+2 f}{44+f}\)
0 = – 40 + 2f
2f = 40
f = \(\frac{40}{2}\) = 20
Hence, the missing frequency (f) = 20.
![]()
Question 4.
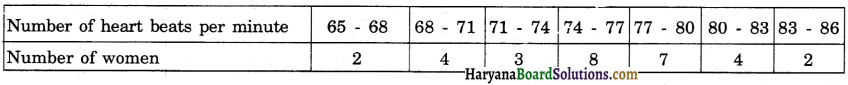
Thirty women were examined in a hospital by a doctor and the number of heart beats per minute were recorded and summarised as follows. Find the mean heart beats per minute for these women, choosing a suitable method.
Solution:
Here, h = 3
From the table, we have a = 75.5, h = 3, Σfi = 30, Σfiui = 4
\(\bar{x}\) = a + \(\left(\frac{\Sigma f_i u_i}{\Sigma f_i}\right)\) × h
\(\bar{x}\) = 75.5 + \(\frac{4}{30}\) × 3
= 75.5 + 0.4
⇒ x = 75.9 .
Hence, mean heart beats per minute = 75.9.
Question 5.
In a retail market, fruit vendors were selling mangoes kept in packing boxes. These boxes contained varying number of mangoes. The following was the distribution of mangoes according to the number of boxes.

Find the mean number of mangoes kept in a packing box. Which method of finding the mean did you choose ?
Solution:
The given series is an inclusive series. It is not necessary to change it in an exclusive series because the class interval includes both 50 and 52. So we take h = 3 (not 2).
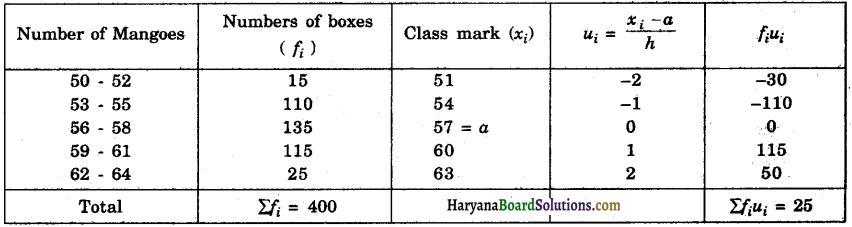
From the table, we have,
a = 57, h = 3, Σfi = 400, Σfiui = 25
\(\bar{x}\) = a + \(\left(\frac{\Sigma f_i u_i}{\Sigma f_i}\right)\) × h
\(\bar{x}\) = 57 + \(\frac{25}{400}\) × 3
\(\bar{x}\) = 57 + 0.19
\(\bar{x}\) = 57.19
Hence, the mean number of mangoes = 57.19
We used step-deviation method.
Question 6.
The table below shows the daily expenditure on food of 25 households in a locality.

Find the mean daily expenditure on food by a suitable method.
Solution:
Here h = 50
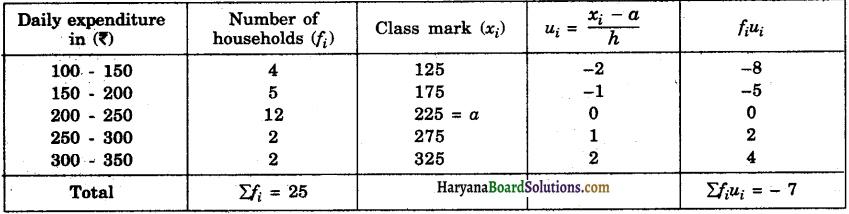
From the table, we have,
Σfi = 25, Σfiui = – 7, a = 225, h = 50
\(\bar{x}\) = a + \(\left(\frac{\Sigma f_i u_i}{\Sigma f_i}\right)\) × h
\(\bar{x}\) = 225 + \(-\frac{7}{25}\) × 50
\(\bar{x}\) = 225 – 14
\(\bar{x}\) = 211
Hence, the mean daily expenditure on food = ₹ 211.
Question 7.
To find out the concentration of SO2 m the air (in parts per million, i.e., ppm), the data was collected for 30 localities in a certain city and is presented below:
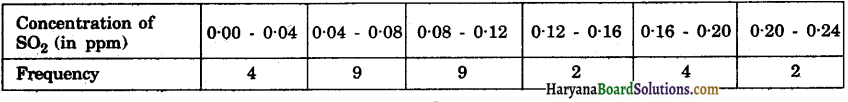
Find the mean concentration of SO2 in the air.
Solution:
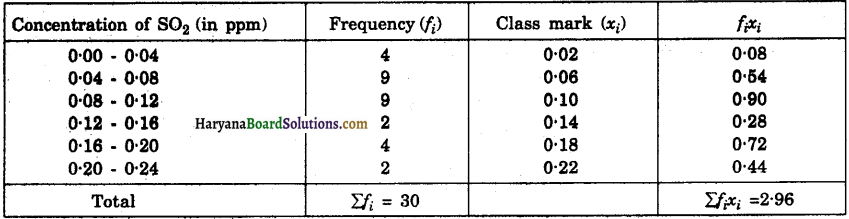
From the table, we have
Σfi = 30, Σfixi = 2.96
∴ \(\bar{x}=\frac{\Sigma f_i x_i}{\Sigma f_i}=\frac{2.96}{30}\) = 0.099
Hence, the mean concentration of SO2 in the air = 0.099 ppm.
Question 8.
A class teacher has the following absentee record of 40 students of a class for the whole term. Find the mean number of days a student was absent.

Solution:
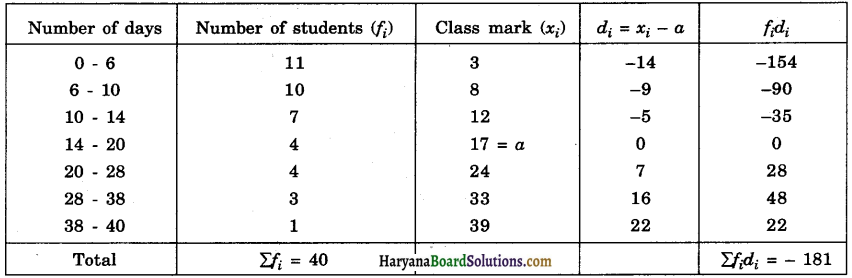
From the table, we have
Σfi = 40, Σfidi = – 181, a = 17
\(\overline{\boldsymbol{x}}\) = a + \(\frac{\Sigma f_i d_i}{\Sigma f_i}\)
\(\overline{\boldsymbol{x}}\) = 17 + (\(-\frac{181}{40}\))
\(\overline{\boldsymbol{x}}\) = 17 – 4.52 = 12.48
Hence, the mean number of days a student was absent = 12.48 days.
Question 9.
The following table gives the literacy rate On percentage) of 35 cities. Find the mean literacy rate.

Solution:
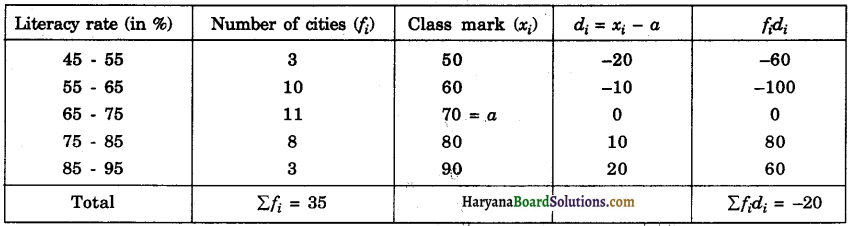
From the table, we have
Σfi = 35, Σfidi = – 20, a = 70
\(\overline{\boldsymbol{x}}\) = a + \(\frac{\Sigma f_i d_i}{\Sigma f_i}\)
\(\overline{\boldsymbol{x}}\) = 70 + (\(-\frac{20}{35}\))
\(\overline{\boldsymbol{x}}\)= 70 – 0.57 = 69.43%.
Hence, the mean literacy rate = 69.43%.