Haryana State Board HBSE 9th Class Maths Important Questions Chapter 14 Statistics Important Questions and Answers.
Haryana Board 9th Class Maths Important Questions Chapter 14 Statistics
Very Short Answer Type Questions
Question 1.
A cumulative frequency distribution is given below. Convert it into a frequency distribution table :
| Age (in years) | No. of teachers |
| less than 20 | 16 |
| less than 30 | 36 |
| less than 40 | 48 |
| less than 50 | 72 |
| less than 60 | 88 |
| less than 70 | 100 |
Solution:
To convert less than cumulative frequency distribution into frequency distribution, we subtract the cumulative frequency of preceding class from the cumulative frequency of each class.
Frequency distribution table
| Age (in years) | No. of teachers (Frequency) |
| 10 – 20 | 16 |
| 20 – 30 | 20 |
| 30 – 40 | 12 |
| 40 – 50 | 24 |
| 50 – 60 | 16 |
| 60 – 70 | 12 |
| Total | 100 |
![]()
Question 2.
A cumulative frequency table is given below. Convert it into a frequency distribution table :
| Marks | No. of students (Cumulative frequency) |
| More than or equal to 80 | 0 |
| More than or equal to 75 | 4 |
| More than or equal to 70 | 11 |
| More than or equal to 65 | 22 |
| More than or equal to 60 | 37 |
| More than or equal to 55 | 45 |
| More than or equal to 50 | 48 |
| More than or equal to 45 | 50 |
Solution:
Frequency distribution table
| Marks | No. of students (Frequency) |
| 45 – 50 | 50 – 48 = 2 |
| 50 – 55 | 48 – 45 = 3 |
| 55 – 60 | 45 – 37 = 8 |
| 60 – 65 | 37 – 22 = 15 |
| 65 – 70 | 22 – 11 = 11 |
| 70 – 75 | 11 – 4 = 7 |
| 75 – 80 | 4 – 0 = 4 |
| Total | 50 |
Question 3.
The mean of ages of 5 students is 15 years. If the individual ages of four of them are 14 years, 15 years, 16 years and 17 years, find the age of fifth student.
Solution:
Mean age of 5 students = 15 years
Sum of ages of 5 students = 15 × 5 = 75 years
Sum of ages of 4 students = 14 + 15 + 16 + 17 = 62 years
Age of fifth student = Sum of ages of 5 students – Sum of ages of 4 students
= 75 – 62
= 13 yeras
Hence, age of fifth student = 13 years.
![]()
Question 4.
If the mean of 10 observations is 18 and that of another 15 observations is 16, find the mean of all 25 observations.
Solution:
Mean of 10 observations = 18
∴ Sum of 10 observations = 18 × 10 = 180
and mean of 15 observations = 16
∴ Sum of 15 observations: 16 × 15 = 240
Sum of (10 + 15 = 25) observations
= 180 + 240 = 420
Mean of 25 observations
= \(\frac{\text { Sum of } 25 \text { observations }}{\text { Total no. of observations }}\)
= \(\frac{420}{25}\) = 16.8
Hence, mean of 25 observations = 16.8.
Question 5.
The mean of 13 results is 20. If the mean of first 7 results is 16 and that of the last 7 results is 25, find the 7th result.
Solution:
Mean of 13 results = 20
Sum of 13 results = 20 × 13 = 260
Mean of first 7 results = 16
Sum of first 7 results = 16 × 7 = 112
and mean of last 7 results = 25
∴ Sum of last 7 results = 25 × 7 = 175
7th result = Sum of first 7 results + Sum of last 7 results – Sum of 13 results
= 112 + 175 – 260 = 27
Hence, 7th result = 27.
Question 6.
Mean weight of 14 members of a group is 60 kg. One more member whose weight is 45 kg has joined the group. Find the mean weight of 15 members of the group.
Solution:
Mean weight of 14 members = 60 kg
∴ Sum of weight of 14 members = 60 × 14 = 840 kg
∵ One member whose weight 45 kg is joined the group.
∴ Sum of weight of 15 (14 + 1) members = 840 + 45 = 885 kg
Mean weight of 15 members = \(\frac{885}{15}\)
= 59 kg
Hence,mean weight of 15 members = 59 kg.
![]()
Question 7.
The mean weight of 50 students of a class is 42 kg. If the weight of a teacher be included, the mean rises 1 kg. Find the weight of the teacher.
Solution:
Mean weight of 50 students = 42 kg
Sum of weight of 50 students = 42 × 50 = 2100 kg
If weight of 1 teacher included mean rises 1 kg i.e.,
Mean weight of (50 students + 1 teacher) = 43 kg
Sum of weight of (50 students + 1 teacher) = 43 × 51 = 2193 kg
Weight of teacher= Sum of weight of (50 students + 1 teacher) – Sum of weight of 50 students
= 2193 – 2100 = 93 kg
Hence,weight of teacher = 93 kg.
Question 8.
Mean of 50 observations was found to be 804. But later on, it was discovered that 96 was misread as 69 at one place. Find the correct mean.
Solution:
Mean of 50 observations = 80.4
Incorrect sum of 50 observations = 80.4 × 50
= 4020.
Correct sum of 50 observations = sum of incorrect 50 observations – incorrect observation + correct observation
= 4020 – 69 + 96 = 4047
∴ correct mean = \(\frac{4047}{50}\) = 80.94
Hence, correct mean = 80.94.
Short Answer Type Questions
Question 1.
The class marks of a distribution are 42, 47, 52, 57, 62, 67, 72, 77, 82, 87, 92, 97. Determine the class size, the class limits and true class limits.
Solution:
Since class marks are uniformly space.
∴ Class size is the difference between any two consecutive class marks.
Class size (h) = 47 – 42 = 5
Half of the class size \(\left(\frac{h}{2}\right)=\frac{5}{2}\) = 2.5
To obtain lower class limit, we substract 2.5 from each class mark and to obtain upper class limit, we add 2.5 to each the class mark.
Class mark of the first class = 42
∴ Corresponding class limits are 42 – 2.5 and 42 + 2.5.
i.e., 39.5 – 44.5
Similarly, we get the following class limits :
| Class Marks | Class Limits |
| 42 | 39.5 – 44.5 |
| 47 | 44.5 – 49.5 |
| 52 | 49.5 – 54.5 |
| 57 | 54.5 – 59.5 |
| 62 | 59.5 – 64.5 |
| 67 | 64.5 – 69.5 |
| 72 | 69.5 – 74.5 |
| 77 | 74.5 – 79.5 |
| 82 | 79.5 – 84.5 |
| 87 | 84.5 – 89.5 |
| 92 | 89.5 – 94.5 |
| 97 | 94.5 – 99.5 |
Since, the classes are exclusive, true class limits are the same as the class limits.
![]()
Question 2.
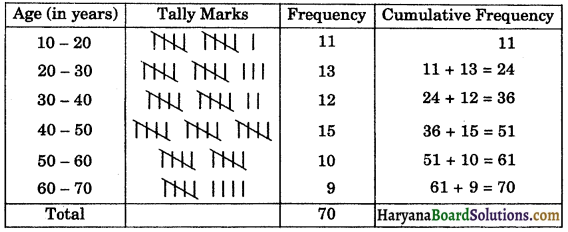
The ages (in years) of 70 patients getting medical treatment in a hospital are:
10, 13, 11, 15, 12, 14, 18, 16, 54, 51, 32, 35, 25, 22, 18, 13, 28, 29, 20, 52, 53, 66, 33, 37, 67, 68, 57, 42, 45, 24, 26, 23, 55, 60, 31, 33, 38, 37, 63, 60, 35, 38, 27, 21, 39, 39, 61, 40, 48, 62, 42, 43, 22, 45, 68, 41, 49, 46, 58, 42, 50, 59, 40, 25, 44, 24, 56, 18, 46, 47
Construct a cumulative frequency (distribution) table.
Solution:
Maximum age = 68 years
Minimum age = 10 years
Range = 68 – 10 = 58 years
Let the class size be 10.
Number of classes = \(\frac{58}{10}\)
= 5.8 = 6, (say)
So, class intervals are 10 – 20, 20 – 30, 30 – 40, 40 – 50, 50 – 60 and 60 – 70
The cumulative frequency distribution table is given below :
Cumulative frequency distribution of ages of patients
Question 3.
Following are the weights (in gm) of 100 apples picked at random from a basket :

Construct the cumulative frequency table (less than type and more than type) for the above data.
Solution:
Less than cumulative frequency table
| Weights (in gm) | Number of apples (Cumulative frequency) |
| Less than 45 | 21 |
| Less than 60 | 21 + 24 = 45 |
| Less than 75 | 45 + 15 = 60 |
| Less than 90 | 60 + 12 = 72 |
| Less than 105 | 72 + 17 = 89 |
| Less than 120 | 89 + 11 = 100 |
More than cumulative frequency table
| Weights (in gm) | Number of apples (Cumulative frequency) |
| More than or equal to 30 | 11 + 17 + 12 + 15 + 24 + 21 = 100 |
| More than or equal to 45 | 11 + 17 + 12 + 15 + 24 = 79 |
| More than or equal to 60 | 11 + 17 + 12 + 15 = 55 |
| More than or equal to 75 | 11 + 17 + 12 = 40 |
| More than or equal to 90 | 11 + 17 = 28 |
| More than or equal to 105 | = 11 |
![]()
Question 4.
The following frequency distribution table gives the production yield per hectare of wheat of 100 farms of a village. Find the unknown values (p, q, r, x, y, z).
| Production yield (in kg/ha) | Number of farms (Frequency) | Cumulative Frequency |
| 50 – 55 | 2 | p |
| 55 – 60 | q | 10 |
| 60 – 65 | 12 | r |
| 65 – 70 | x | 46 |
| 70 – 75 | 38 | y |
| 75 – 80 | 16 | z |
Solution:
Since the given frequency distribution is the frequency distribution of production yield of 100 farms. Therefore z = 100.
| Production yield (in kg/ha) | Number of farms (Frequency) | Cumulative Frequency |
| 50 – 55 | 2 | 2 = p |
| 55 – 60 | q | 2 + q = 10 |
| 60 – 65 | 12 | 12 + 10 = r |
| 65 – 70 | x | 12 + 10 + x = 46 |
| 70 – 75 | 38 | 46 + 38 = y |
| 75 – 80 | 16 | z = 100 |
From the table, we get
p = 2
2 + g = 10
⇒ q = 10 – 2 = 8
r = 10 + 12 = 22
12 + 10 + x = 46
⇒ 22 + x = 46
⇒ x = 46 – 22
⇒ x = 24
y = 46 + 38
⇒ y = 84
and z = 100
Hence, p = 2, q = 8, r = 22, x = 24, y = 84 and z = 100.
Question 5.
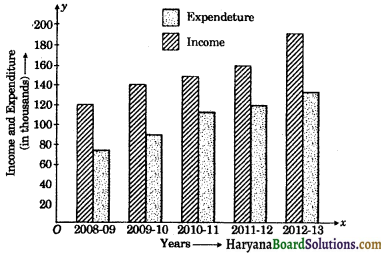
The income and expenditure for 5 years of a family is given in the following data :
| Years | Income (in thousands) | Expenditure Years (in thousands) |
| 2008 – 2009 | 120 | 70 |
| 2009 – 2010 | 140 | 90 |
| 2010 – 2011 | 150 | 115 |
| 2011 – 2012 | 165 | 120 |
| 2012 – 2013 | 195 | 135 |
Draw a bar graph to represent the above data.
Solution:
We draw the bar graph of this data in the following steps :
(i) We draw a horizontal and vertical line.
(ii) We represent the years on horizontal axis on a suitable scale. We take equal widths for all bars and maintain equal gaps in between. Let one head be represented by one unit.
(iii) We represent income (in thousands) and expenditure (in thousands) along vertical axis. Let 1 unit = Rs. 20 thousands.
(iv) To represent first head, we draw a rectangular bars with width 1 unit and heights 6 units and 3.5 units.
(v) Similarly, other heads are represented leaving gap of 2 units in between two consecutive bars.
![]()
Question 6.
If \(\bar{x}\) is the mean of n observations x1, x2, …, xn, then show \(\sum_{i=1}^n\left(x_i-\bar{x}\right)=0\)
Solution:
Since \(\bar{x}\) is the mean of n observations x1, x2, ……., xn.
∴ \(\bar{x}\) = \(\frac{x_1+x_2+\ldots+x_n}{n}\)
⇒ n\(\bar{x}\) = x1 + x2 + … + xn …(1)
Now, = (x1 – \(\bar{x}\)) + (x2 – \(\bar{x}\))+…+(xn – \(\bar{x}\))
= (x1 + x2 + …… + xn) – n\(\bar{x}\)
= n\(\bar{x}\) – n\(\bar{x}\), [Using (1)]
= 0
Hence, \(\sum_{i=1}^n\left(x_i-\bar{x}\right)=0\) Hence Proved.
Question 7.
The mean of n observations x1, x2, …, xn is \(\bar{x}\). If a is added to each of the observations, show that mean of new set of observations is \(\bar{x}\) + a.
Solution:
Since \(\bar{x}\) is the mean of n observations x1, x2, …, xn.
∴ \(\bar{x}\) = \(\frac{x_1+x_2+\ldots+x_n}{n}\)
⇒ n\(\bar{x}\) = x1 + x2 + … + xn … (1)
If a is added to each observation. Sum of observations of new set
= (x1 + a) + (x2 + a) + ……. + (xn + a)
Mean of observations of new set
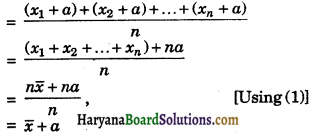
Hence, mean of observations of new set = \(\bar{x}\) + a.
Proved.
Question 8.
The mean of 18 members is 5. If 2 is added to every number, find the new mean.
Solution:
Here, n = 18, \(\bar{x}\) = 5
We know that
∴ \(\bar{x}\) = \(\frac{x_1+x_2+\ldots+x_n}{n}\)
⇒ 5 = \(\frac{x_1+x_2+\ldots+x_{18}}{18}\)
⇒ 90 = x1 + x2 + … + x18 …(i)
Since, 2 is added to every number, then new numbers are (x1 + 2), (x2 + 2), …, (x18 + 2).
Then,mean of new numbers
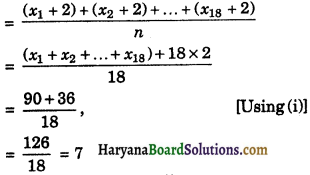
Hence, new mean = 7.
![]()
Question 9.
The mean of n observations x1, x2, …, xn is \(\bar{x}\). If each observation is multiplied by non-zero number a, then show that mean of new observations is a\(\bar{x}\).
Solution:
Since mean of n observations x1, x2, …, xn is \(\bar{x}\).
∴ \(\bar{x}\) = \(\frac{x_1+x_2+\ldots+x_n}{n}\)
n\(\bar{x}\) = x1 + x2 + … + xn …(1)
If each observation is multiplied by a, then new observations are ax1, ax2, …, axn.
Sum of new observations
= ax1 + ax2 + … + axn
Mean of new observations
= \(\frac{a x_1+a x_2+\ldots+a x_n}{n}\)
= \(\frac{a\left(x_1+x_2+\ldots+x_n\right)}{n}\)
= \(\frac{a \times n \bar{x}}{n}\)
= a\(\bar{x}\)
Hence,mean of new observations = a\(\bar{x}\).
Proved
Question 10.
Mean of 12 numbers is 20. If each number is multiplied by 3, what will be the new mean.
Solution:
Here, n = 12, \(\bar{x}\) = 20
We know that
\(\bar{x}\) = \(\frac{x_1+x_2+\ldots+x_n}{n}\)
⇒ 20 = \(\frac{x_1+x_2+\ldots+x_{12}}{12}\)
⇒ x1 + x2 + … + x12 = 20 × 12 = 240 …..(1)
Since, each number is multiplied by 3, then new numbers are 3x1, 3x2, …, 3x12.
Sum of new numbers = 3x1 + 3x2 +…+ 3x12
Mean of new numbers
= \(\frac{3 x_1+3 x_2+\ldots+3 x_{12}}{12}\)
= \(\frac{3\left(x_1+x_2+\ldots+x_12\right)}{12}\)
= \(\frac{3 \times 240}{12}\), [Using (1)]
= 60
Hence, new mean = 60.
Question 11.
The mean weight of the students of a class is 40 kg. The mean weight of the boys is 45 kg and that of girls is 36 kg. Find the ratio of the number of boys to number of girls.
Solution:
Let the number of boys be n1 and number of girls be n2, then
Mean of n1 boys (\(\bar{x}_1\)) = 45 kg
Mean of n2 girls (\(\bar{x}_2\)) = 36 kg
and mean of (n1 + n2) students (\(\bar{x}[/katex]) = 40 kg
We know that, ([latex]\bar{x}\)) = \(\frac{n_1 \bar{x}_1+n_2 \bar{x}_2}{n_1+n_2}\)
⇒ 40 = \(\frac{n_1 \times 45+n_2 \times 36}{n_1+n_2}\)
⇒ 40n1 + 40n2 = 45n1 + 36n2
= 40n2 – 36n2 = 45n1 – 40n1
⇒ 4n2 = 5n1
⇒ \(\frac{n_1}{n_2}=\frac{4}{5}\)
⇒ n1 : n2 = 4 : 5
Hence,number of boys : number of girls = 4 : 5.
![]()
Question 12.
The mean marks of 150 students in an examination was 60. The mean marks of boys was found to be 70 and that of the girls was 55. Find the number of boys and number of girls in the class.
Solution:
Let the number of boys be n1 and number of girls be n2, then
n1 + n2 = 150 ……(1)
Mean marks of 150 students (\(\bar{x}\)) = 60
Mean marks of n1 boys (\(\bar{x}\)) = 70
and mean marks of n2 girls (\(\bar{x}\)) = 55
We know that, (\(\bar{x}\)) = \(\frac{n_1 \bar{x}_1+n_2 \bar{x}_2}{n_1+n_2}\)
⇒ 60 = \(\frac{n_1 \times 70+n_2 \times 55}{150}\)
[Using (1)]
⇒ 60 × 150 = 70n1 + 55n2
⇒ 150 × 12 = 14n1 + 11n2
⇒ 14n1 + 11n2 = 1800 ……(2)
Multiplying equation (1) by 14 and subtracting equation (2) from (1), we get
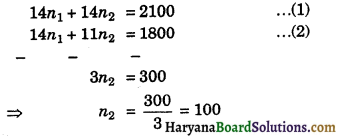
Putting the value of n2 in equation (1), we get
n1 + 100 = 150
⇒ n1 = 150 – 100 = 50
Hence, number of boys = 50 and number of girls = 100.
Question 13.
The following observations have been arranged in ascending order. If median of data is 39, then find the value of x:
18, 24, 26, 29, x, x + 4, 45, 57, 59, 63.
Solution:
Here, median = 39
n = 10, which is even
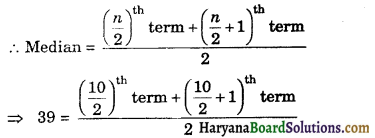
⇒ 78 = 5th term + 6th term
⇒ 78 = x + x + 4
⇒ 78 = 2x + 4
2x = 78 – 4 = 74
⇒ x = \(\frac{74}{2}\) = 37
Hence, x = 37.
Question 14.
Find the median of the following observations:
33, 68, 55, 72, 44, 63, 74, 85, 52, 40, 45
If 44 is replaced by 64 and 74 by 58 in the above data, then find the new median.
Solution:
We arrange the data in ascending order :
33, 40, 44, 45, 52, 55, 63, 68, 72, 74, 85
Here, n = 11, which is odd
∴ Median = \(\left(\frac{n+1}{2}\right)^{\mathrm{th}}\) term
= \(\left(\frac{11+1}{2}\right)^{\mathrm{th}}\) term
= 6th term
= 55
If 44 is replaced by 64 and 74 by 58, then we obtain new data of observations in ascending order as follow :
33, 40, 45, 52, 55, 58, 63, 64, 68, 72, 85
Here, n = 11
∴ Median = 6th term
= 58.
Hence, median = 55 and new median = 58
![]()
Long Answer Type Questions
Question 1.
The following are the marks (out of 100) of 60 students in mathematics
16, 15, 5, 80, 86, 7, 51, 48, 24, 56, 70, 19, 61, 17, 16, 36, 34, 42, 35, 72, 55, 75, 31, 52, 28, 72, 97, 74, 45, 62, 68, 86, 35, 85, 36, 81, 75, 55, 26, 95, 31, 7, 78, 92, 62, 52, 56, 15, 63, 25, 36, 54, 44, 47, 27, 72, 17, 4, 30, 34
(i) construct a grouped frequency distribution table with width 10 of each class starting from 0 – 9, 10 – 19, itc, (i.e., inclusive form)
(ii) Construct a grouped frequency distribution table with width 10 of each class, in such a way that one of the classes is 10 – 20 (20 is not included) i.e., exclusive form.
Solution:
Highest marks = 97
Lowest maks = 4
Range = 97 – 4 = 93
Width of class = 10
No. of classes = \(\frac{93}{10}\) = 9.3 = 10 (say)
(i) For inclusive from :
The class intervals of the data are :
0 – 9, 10 – 19, 20 – 29, 30 – 39, 40 – 49, 50 – 59, 60 – 69, 70 – 79, 80 – 89, 90 – 99
Frequency distribution of marks
| Class Intervals | Frequency |
| 0 – 9 | 4 |
| 10 – 19 | 7 |
| 20 – 29 | 5 |
| 30 – 39 | 10 |
| 40 – 49 | 5 |
| 50 – 59 | 8 |
| 60 – 69 | 5 |
| 70 – 79 | 8 |
| 80 – 89 | 5 |
| 90 – 99 | 3 |
| Total | 60 |
For exclusive form :
The class intervals of the data are :
0 – 10, 10 – 20, 20 – 30, 30 – 40, 40 – 50, 50 – 60, 60 – 70, 70 – 80, 80 – 90, 90 – 100
Frequency distribution of marks
| Class Intervals | Frequency |
| 0 – 10 | 4 |
| 10 – 20 | 7 |
| 20 – 30 | 5 |
| 30 – 40 | 10 |
| 40 – 50 | 5 |
| 50 – 60 | 8 |
| 60 – 70 | 5 |
| 70 – 80 | 8 |
| 80 – 90 | 5 |
| 90 – 100 | 3 |
| Total | 60 |
![]()
Question 2.
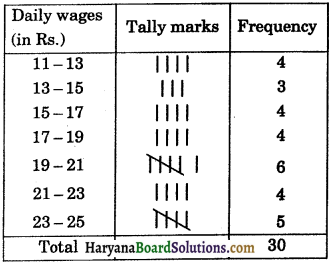
For the following data of daily wages (in Rs.) received by 30 labourers in a certain factory, construct a grouped frequency distribution table by dividing the range into class interval of equal width, each corresponding to Rs. 2, in such a way that the mid value of the first class interval corresponds to Rs. 12.
11, 22, 24, 16, 15, 17, 23, 20, 17, 18, 19, 23, 18, 12, 11, 12, 13, 13, 14, 15, 16, 20, 19, 19, 20, 22, 22, 21, 24, 23.
Solution:
Maximum daily wage = Rs. 24
Minimum daily wage = Rs. 11
Range = Rs. 24 – Rs. 11 = Rs. 13
Size of the class interval = Rs. 2
∴Number of class intervals = \(\frac{13}{2}\) = 6.5
= 7 (say)
∵Mid value of first class interval = 12
and size of class interval = 2
Let the lower limit of first class interval be x, then its upper limit = x + 2
Mid value of class interval = \(\frac{\text { lower limit + upper limit }}{2}\)
⇒ 12 = \(\frac{x+x+2}{2}\)
⇒ 24 = 2x + 2
⇒2x = 24 – 2 = 22
⇒ x = \(\frac{22}{2}\) = 11
∴The first class interval is 11 – 13 and other class intervals are :
13 – 15, 15 – 17, 17 – 19, 19 – 21, 21 – 23, 23 – 25
∴Frequency distribution table is given below :
Frequency distribution of wages of 30 labourers
Question 3.
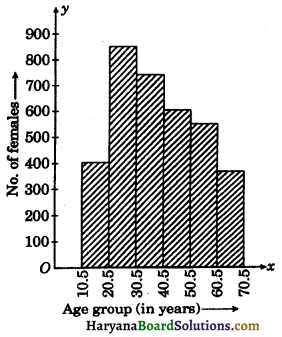
The following table shows the number of females in the group (10 – 70) in a town:
| Age group (in years) | No. of females |
| 11 – 20 | 400 |
| 21 – 30 | 850 |
| 31 – 40 | 730 |
| 41 – 50 | 600 |
| 51 – 60 | 550 |
| 61 – 70 | 370 |
| Total | 3500 |
Draw a histogram to represent the above data.
Solution:
Here the class intervals are discontinuous. So, we convert it into continuous class intervals. For this we subtract \(\frac{h}{2}=\frac{1}{2}\) = 0.5 from each of lower limit and add 0.5 to each upper limit. So, continuous class intervals obtained as follows:
| Age group (in years) | No. of females (Frequency) |
| 10.5 – 20.5 | 400 |
| 20.5 – 30.5 | 850 |
| 30.5 – 40.5 | 730 |
| 40.5 – 50.5 | 600 |
| 50.5 – 60.5 | 550 |
| 60.5 – 70.5 | 370 |
We represent the age group (in years) along x-axis on a suitable scale and corresponding frequencies along y-axis on a suitable scale.
We construct rectangles with class intervals as bases and the corresponding frequencies as heights.
Thus, we obtain a histogram as shown below :
![]()
Question 4.
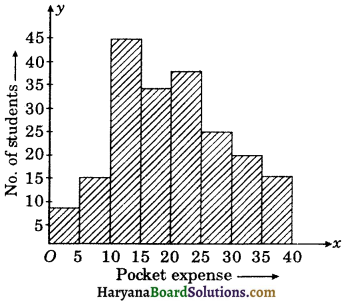
The daily pocket expense (in Rs.) of 200 students in a school are given below :
| Pocket expense (mid value) | No. of students (Frequency) |
| 2.5 | 8 |
| 7.5 | 15 |
| 12.5 | 45 |
| 17.5 | 35 |
| 22.5 | 38 |
| 27.5 | 25 |
| 32.5 | 20 |
| 37.5 | 14 |
Pocket expense (mid value)
Draw a histogram to represent the above data.
Solution:
Since class marks are uniformly space.
∴ Class size is the difference between any two consecutive class marks.
Class size (h) = 7.5 – 2.5 = 5
Half of the class size \(\left(\frac{h}{2}\right)=\frac{5}{2}\) = 2.5
To obtain lower class limit, we substract 2.5 from each class mark and to obtain upper class limit, we add 2.5 to the class mark. Class mark of the first class = 2:5
∴ Corresponding class limits are
2.5 – 2.5 and 2.5 + 2.5 i.e., 0 – 5
Similarly, we obtain the other classes as under:
| Pocket expense | No. of students (Frequency) |
| 0 – 5 | 8 |
| 5 – 10 | 15 |
| 10 – 15 | 45 |
| 15 – 20 | 35 |
| 20 – 25 | 38 |
| 25 – 30 | 25 |
| 30 – 35 | 20 |
| 35 – 40 | 14 |
We represent the pocket expense (in Rs.) along x-axis on a suitable scale and corresponding frequencies along y-axis. We construct rectangles class intervals as bases and corresponding frequencies as heights. Thus we obtain a histogram as shown below :
Question 5.
Construct a histogram and a frequency polygon for the following data :
| Scores | Frequency |
| 20 – 24 | 12 |
| 25 – 29 | 15 |
| 30 – 34 | 24 |
| 35 – 39 | 21 |
| 40 – 44 | 16 |
| 45 – 49 | 9 |
| 50 – 54 | 7 |
Solution:
Here the class intervals are in inclusive form. For coverting it into exclusive form, we subtract \(\frac{h}{2}=\frac{1}{2}\) = 0.5 from each of lower limit and add 0.5 to each upper limit. So, exclusive form of distribution table obtained as follows :
| Scores | Frequency |
| 19.5 – 24.5 | 12 |
| 24.5 – 29.5 | 15 |
| 29.5 – 34.5 | 24 |
| 34.5 – 39.5 | 21 |
| 39.5 – 44.5 | 16 |
| 44.5 – 49.5 | 9 |
| 49.5 – 54.5 | 7 |
Let us first draw a histogram for this data and mark the mid points of the tops of the rectangles as B, C, D, E, F, G, H respectively. Here, the first class is 19.5 – 24.5, so to find the class preceeding 19.5 – 24.5 and find the mid point of the imaginary class interval (14.5 – 19.5). The first end point i.e., B is joined with the mid point of the imaginary class interval (14.5 – 19.5) and it is marked as A. Let I be mid point of the class succeeding the last class of the given data. Then ABCDEFGHI is the frequency polygon, which is shown below figure

Question 6.
The mean of the following distribution is 50.
| x | f |
| 10 | 17 |
| 30 | 5a + 3 |
| 50 | 32 |
| 70 | 7a – 11 |
| 90 | 19 |
Find the value of a and hence the frequencies of 30 and 70.
Solution:
For calculating the mean, we prepare the following table
| x | f | f × x |
| 10 | 17 | 170 |
| 30 | 5a + 3 | 150a + 90 |
| 50 | 32 | 1600 |
| 70 | 7a – 11 | 490a – 770 |
| 90 | 19 | 1710 |
| Total | 60 + 12a | 2800 + 640a |
From table, we have
\(\sum_{i=1}^n f_i\) = 60 + 120 and \(\sum_{i=1}^n f_i x_i\) = 2800 + 640a
Mean of distribution = 50 (given)
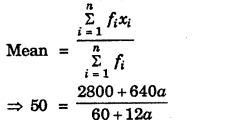
⇒ 3000 + 600a = 2800 + 640a
⇒ 3000 – 2800 = 640a – 600a
⇒ 40a = 200
⇒ a = \(\frac{200}{40}\) = 5
Frequency of 30 = 5a + 3 = 5 × 5 + 3 = 28
Frequency of 70 = 7a – 11 = 7 × 5 – 11 = 24
Hence, a = 5, frequencies of 30 and 70 are 28 and 24 respectively.
![]()
Question 7.
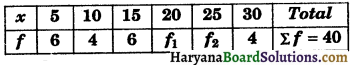
Find the missing frequencies, if mean of the following distribution is 18.
Solution:
For calculating the mean, we prepare the following table :
| x | f | f × x |
| 5 | 6 | 30 |
| 10 | 4 | 40 |
| 15 | 6 | 90 |
| 20 | f1 | 20f1 |
| 25 | f2 | 25f2 |
| 30 | 4 | 120 |
| Total | 20 + f1 + f2 = 40 | 280 + 20f1 + 25f2 |
From the table, we get
\(\sum_{i=1}^n f_i\) = 40 or 20 + f1 + f2 = 40
⇒ f1 + f2 = 20 …..(1)
and \(\sum_{i=1}^n f_i x_i\) = 280 + 20f1 + 25f2, mean = 18
We know that, mean = \(\sum_{i=1}^n f_i x_i\)
⇒ 720 = 280 + 20f1 + 25f2
⇒ 20f1 + 25f2 = 720 – 280
⇒ 20f1 + 25f2 = 440 …….(2)
Multiplying the equation (1) by 20 and substracting from equation (2), we get
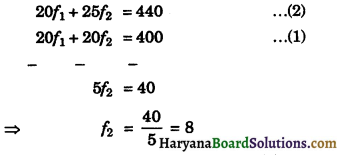
Putting the value of f2 in equation (1), we get
f1 + 8 = 20
⇒ f1 = 20 – 8 = 12
Hence, f1 = 12 and f2 = 8.
Multiple Choice Questions
Choose the correct answer in each of the following:
Question 1.
The class mark of the class 20 – 30 is:
(a) 20
(b) 25
(c) 30
(d) 35
Answer:
(c) 30
Question 2.
The range of the data of observations is :
33, 56, 17, 44, 26, 47, 58, 40, 67, 54, 37, 22, 35, 52, 63
(a) 46
(b) 41
(c) 50
(d) 67
Answer:
(c) 50
![]()
Question 3.
In the class intervals 10 – 20, 20 – 30, the number 20 is included in :
(a) 10 – 20
(b) 20 – 30
(c) both the intervals
(d) none of these intervals
Answer:
(d) none of these intervals
Question 4.
In a frequency distribution, the mid value of a class is 10 and the width of the class is 6. The lower limit of the class is:
(a) 6
(b) 7
(c) 8
(d) 12
Answer:
(b) 7
Question 5.
The mid value of a class interval is 32. If the class size is 10, then the class interval is :
(a) 27.5 – 37.5
(b) 37.5 – 27.5
(c) 22 – 42
(d) 27 – 37
Answer:
(c) 22 – 42
Question 6.
The class marks of a frequency distribution are 5, 10, 15, 20, ……..
The class corresponding to the class mark 15 is :
(a) 7.5 – 12:5
(b) 12.5 – 17.5
(c) 17.5 – 22.5
(d) 22.5 – 27.5
Answer:
(d) 22.5 – 27.5
![]()
Question 7.
The tabular arrangement of data, showing the frequency of each observation is called:
(a) frequency
(b) cumulative frequency
(c) frequency distribution
(d) none of these
Answer:
(d) none of these
Question 8.
The difference between the true upper limit and the true lower limit of a class is called its :
(a) class size
(b) class mark
(c) range
(d) none of these
Answer:
(c) range
Question 9.
The number of times a particular item occurs in a class interval is called its :
(a) Frequency distribution
(b) Variation
(c) Frequency
(d) Cumulative frequency
Answer:
(d) Cumulative frequency
Question 10.
In a histogram the area of each rectangle is proportional to :
(a) The class size of the corresponding class interval
(b) The class mark of the corresponding class interval
(c) Cumulative frequency of the corresponding class interval
(d) Frequency of the corresponding class interval.
Answer:
(a) The class size of the corresponding class interval