Haryana State Board HBSE 10th Class Maths Solutions Chapter 14 Statistics Ex 14.4 Textbook Exercise Questions and Answers.
Haryana Board 10th Class Maths Solutions Chapter 14 Statistics Ex 14.4
Question 1.
The following distribution gives the daily income of 50 workers of a factory.
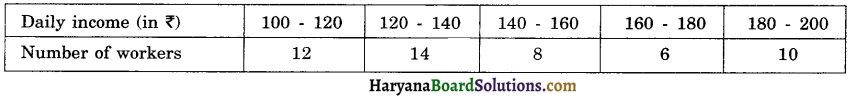
Convert the distribution above to less than type cumulative frequency distribution, and draw its ogive.
Solution:
We prepare the cumulative frequency table by less than method as given :
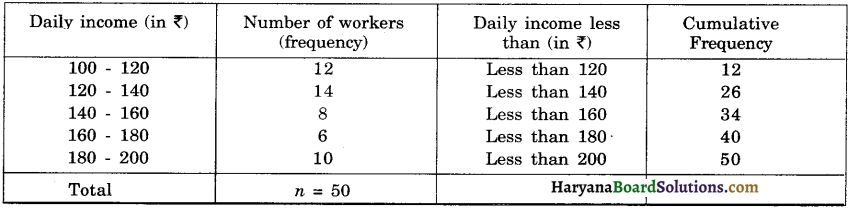
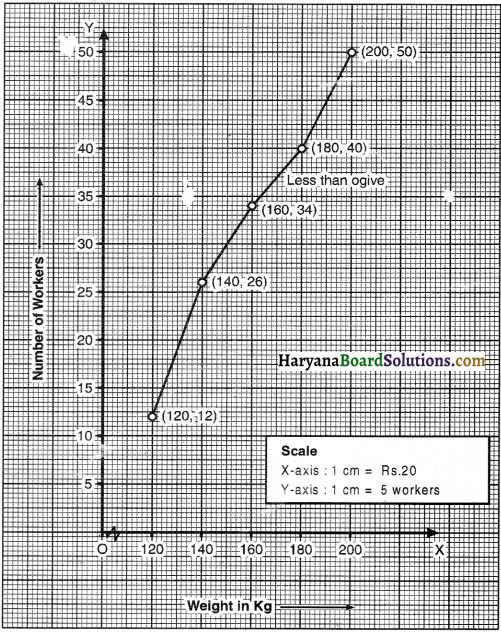
We plot the points (120, 12), (140, 26), (160, 34), (180, 40), (200, 50) on the graph paper. Joining these points with a free hand to get less than curve as shown in graph.
![]()
Question 2.
During the medical check up of 35 students of a class, their weights were recorded as follows:
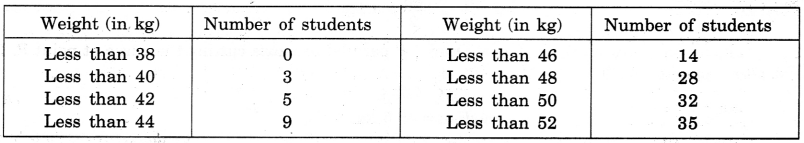
Draw a less than type give for the given data. Hence, obtain the median weight from the graph and verify the result by using the formula.
Solution:
We convert the cumulative frequency table into depicting class intervals with their respective frequencies as given below :
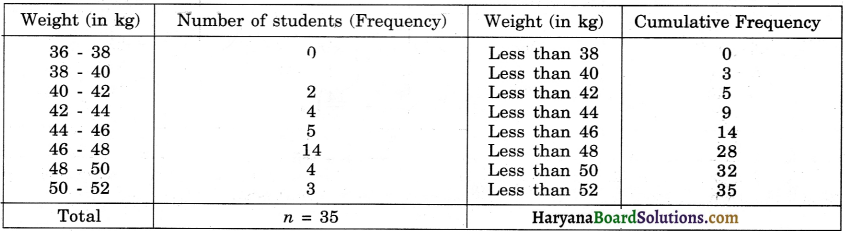
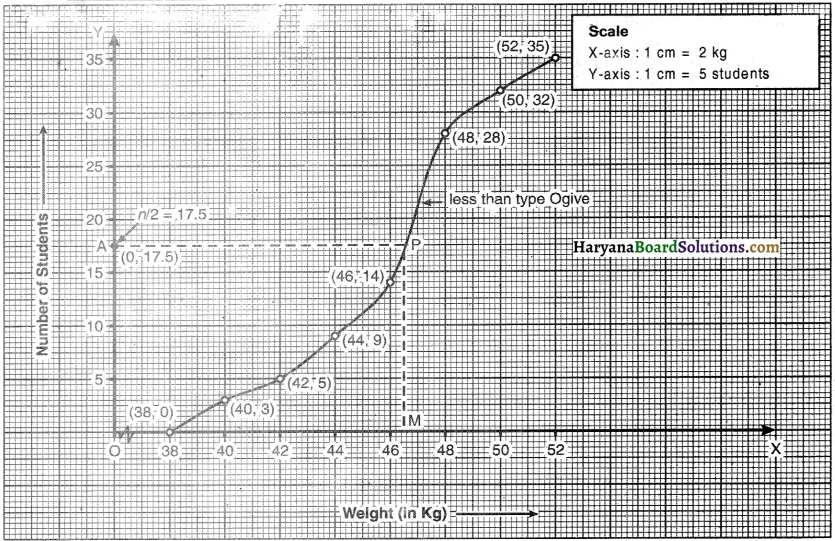
We plot the points (38, 0), (40, 3), (42, 5), (44, 9), (46, 14), (48, 28), (50, 32) and (52, 35) on the graph paper.
Joining these points with a free hand to get less than ogive curve as shown in ahead graph. .
We have, n = 35
⇒ \(\frac{n}{2}=\frac{35}{2}\) = 17.5
Take a point A (0, 17 5) on y-axis. Draw AP parallel to x-axis cutting the curve at point P. Draw PM perpendicular to OX intersecting OX at M.
OM = 46.5
Hence median = 46.5 kg.
Now, \(\frac{n}{2}\) = 17.5
But 17.5 comes under the cumulative frequency 28. The class interval against the cumulative frequency 17.5 is 46 – 48. So, it is the median class.
∴ l = 46, cf = 14, f = 14, and h = 2 .
Median = l + \(\left(\frac{\frac{n}{2}-c f}{f}\right)\)
46 + \(\left(\frac{17 \cdot 5-14}{14}\right)\) × h
= 46 + \(\frac{3.5}{7}\) × 2
= 46 + 0.5 = 46.5 kg.
Hence, median in both cases is 46.5 kg.
![]()
Question 3.
The following table gives production yeild per hectare of wheat of 100 farms of a village.
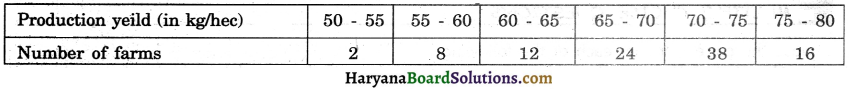
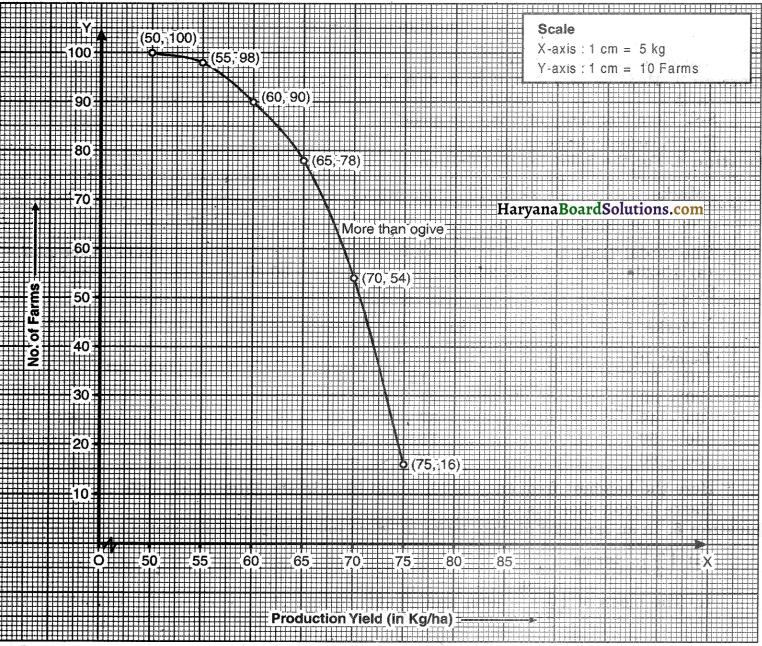
Change the distribution to a more than type distribution, and draw its give.
Solution:
We prepare the cumulative frequency table by more than type method as given :
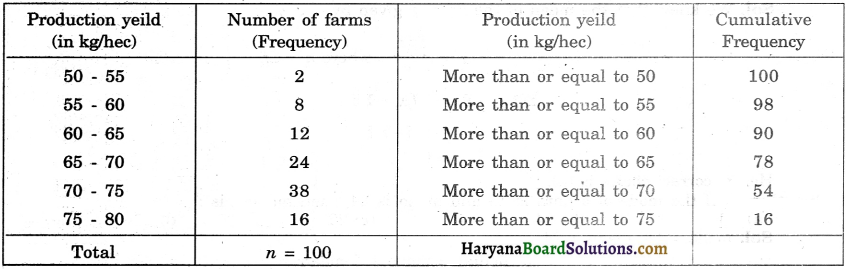
We plot the points (50, 100), (55, 98), (60, 90), (65, 78), (70, 54) and (75, 16) on the graph paper.
Joining these points with free hand to obtain more than type give curve as shown below in graph.