Haryana State Board HBSE 10th Class Maths Solutions Chapter 14 Statistics Ex 14.2 Textbook Exercise Questions and Answers.
Haryana Board 10th Class Maths Solutions Chapter 14 Statistics Ex 14.2
Question 1.
The following table shows the ages of the patients admitted in a hospital during a year:
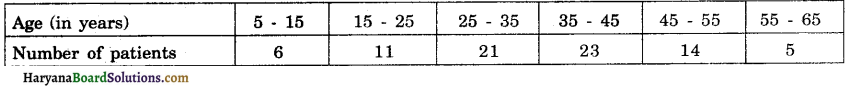
Find the mode and the mean of the data given above. Compare and interpret the two measures of central tendency.
Solution:
The class 35 – 45 has maximum frequency. So, it is the modal class.
∴ l = 35, f1 = 23, f0 = 21, f2 = 14 and h = 10
Mode = l + \(\left(\frac{f_1-f_0}{2 f_1-f_0-f_2}\right)\) × h
= 35 + \(\left(\frac{23-21}{2 \times 23-21-14}\right)\) × 10
= 35 \(\left(\frac{2}{46-21-14}\right)\) × 10
= 35 + 1.8 = 36.8 years
Now let us find the mean of the data.
Here h = 10
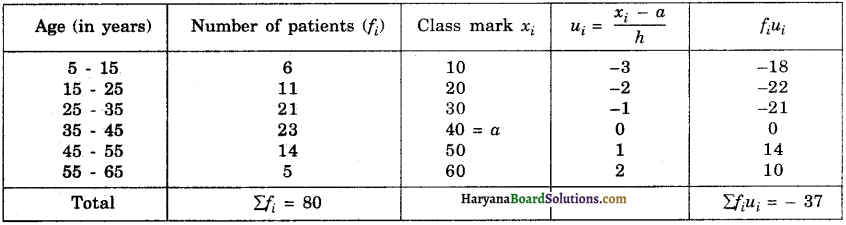
From the table, we have
Σfi = 80, Σfiui = – 37, a = 40, and h = 10
Mean = a + \(\left(\frac{\Sigma f_i u_i}{\Sigma f_i}\right)\)
= 40 + \(\frac{-37}{80}\) × 10
= 40 – 4.63 = 35.37 years.
Hence, mode = 36.8 years and mean = 35.37 years.
Maximum number of patients admitted in the hospital are of the age 36.8 years (approx).
While on an average the age of a patient admitted in the hospital is 35.37 years.
![]()
Question 2.
The following data gives the information on the observed lifetimes (in hours) of 225 electrical components:

Determine the modal lifetimes of the components.
Solution:
The class 60 – 80 has maximum frequency. So, it is the modal class.
∴ l = 60, f1 = 61, f0 = 52, f2 = 38 and h = 20
Mode = l + \(\left(\frac{f_1-f_0}{2 f_1-f_0-f_2}\right)\) × h
= 60 + \(\left(\frac{61-52}{2 \times 61-52-38}\right)\) × 20
= 60 + \(\left(\frac{9}{122-52-38}\right)\) × 20
= 60 + \(\frac{180}{32}\)
= 60 + 5.625 = 65.625 hours.
Hence, the modal lifetimes of the electrical components = 65.625 years.
Question 3.
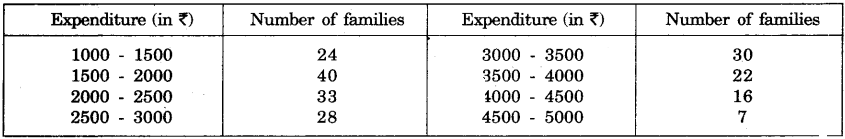
The following data gives the distribution of total monthly household expenditure of 200 families of a village. Find the modal monthly expenditure of the families. Also, find the mean monthly expenditure :
Solution:
The class 1500 – 2000 has maximum frequency. So, it is the modal class.
∴ l = 1500, f1 = 40, f0 = 24, f2 = 33 and h = 500
Mode = l + \(\left(\frac{f_1-f_0}{2 f_1-f_0-f_2}\right)\) × h
= 1500 + \(\left(\frac{40-24}{2 \times 40-24-33}\right)\) × 500
= 1500 + \(\left(\frac{16}{80-24-33}\right)\) × 500
= 1500 + \(\frac{8000}{23}\)
= 1500 + 347.83 = 1847.83
Now, let us find the mean. Here h = 500.
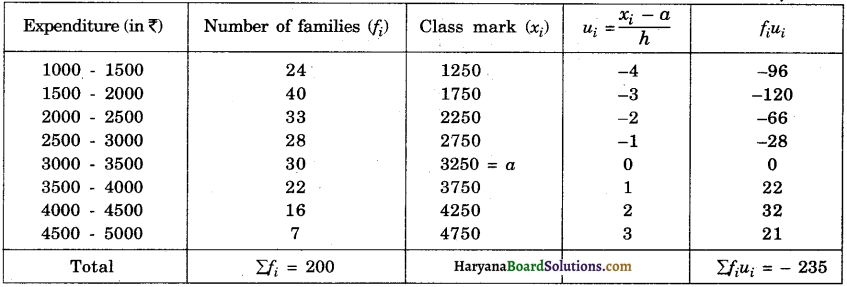
From the table, we have
Σfi = 200, Σfiui = – 235, a = 3250 and h = 500
Mean = a + \(\left(\frac{\Sigma f_i u_i}{\Sigma f_i}\right)\) × h
= 3250 + (\(\frac{-235}{200}\)) × 500
= 3250 – 587.5 = ₹ 2662-5
Hence, modal monthly expenditure = ₹ 1847.83
Mean monthly expenditure = ₹ 2662.5.
![]()
Question 4.
The following distribution gives the state-wise teacher-student ratio in the higher secondary schools of India. Find the mode and mean of this data. Interpret the two measures.
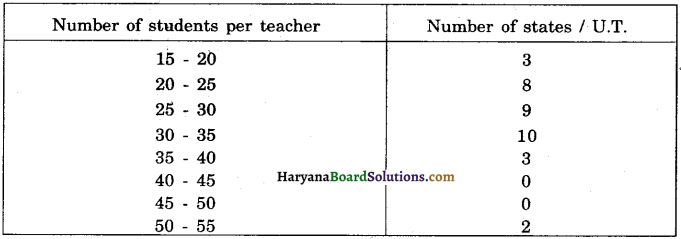
Solution:
The class 30 – 35 has maximum frequency.
So, it is the modal class.
∴ l = 30, f1= 10, f0 = 9, f2 = 3, and h = 5
Mode = l + \(\left(\frac{f_1-f_0}{2 f_1-f_0-f_2}\right)\) × h
= 30 + \(\left(\frac{10-9}{2 \times 10-9-3}\right)\) × 5
= 30 + \(\left(\frac{1}{8}\right)\) × 5
= 30 + \(\frac{5}{8}\)
= 30 + 0.625 = 30.625.
Now, let us find the mean.
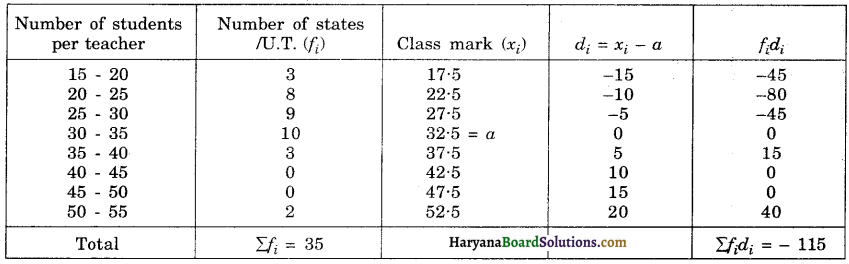
From the table, we have
Σfi = 35, Σfidi = – 115, and a = 32.5
Mean = a + \(\frac{\Sigma f_i d_i}{\Sigma f_i}\)
= 32.5 + \(\left(\frac{-115}{35}\right)\)
= 32.5 – 3.3 = 29.2
Hence, mode = 30.6 and mean = 29.2.
We conclude that most of the states/U.T. have a student- teacher ratio of 30.6 and on an average, this ratio is 29.2.
![]()
Question 5.
The given distribution shows the number of runs scored by some top batsmen of the world in one-day international cricket matches.
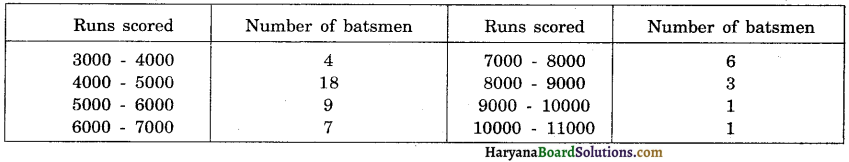
Find the mode of the data.
Solution:
The class 4000 – 5000 has maximum frequency. So, it is the modal class.
∴ I = 4000, f1 = 18, f0 = 4, f2 = 9 and h = 1000.
Mode = l + \(\left(\frac{f_1-f_0}{2 f_1-f_0-f_2}\right)\) × h
= 4000 + \(\left(\frac{18-4}{2 \times 18-4-9}\right)\) × 1000
= 4000 + \(\left(\frac{14}{36-4-9}\right)\) × 100
= 4000 + \(\left(\frac{14000}{23}\right)\)
Hence, mode = 4608.7 runs.
![]()
Question 6.
A student noted the number of cars passing through a spot on a road for 100 periods each of 3 minutes and summarised it in the table given below. Find the mode of the data.
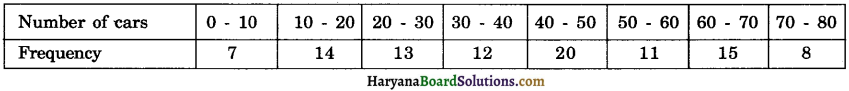
Solution:
The class 40 – 50 has maximum frequency.
So, it is the modal class.
∴ l = 40, f1 = 20, f0 = 12, f2 = 11 and h = 10
Mode = l + \(\left(\frac{f_1-f_0}{2 f_1-f_0-f_2}\right)\) × h
= 40 + \(\left(\frac{20-12}{2 \times 20-12-11}\right)\) × 10
= 40 + \(\left(\frac{8}{40-12-11}\right)\) × 10
= 40 + \(\frac{80}{17}\)
= 40 + 4.7 = 44.7
mode = 44.7 cars.