Haryana State Board HBSE 10th Class Maths Important Questions Chapter 14 Statistics Important Questions and Answers.
Haryana Board 10th Class Maths Important Questions Chapter 14 Statistics
Short/Long Answer Type Questions
Question 1.
Per day expenses of 25 families of the frequency distribution of a Dhani of a village is given as follows:
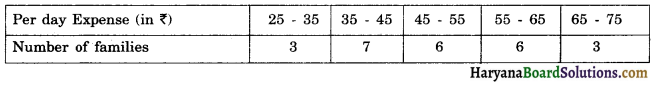
Find the mean expense of families by direct method.
Solution :
We prepare the cumulative frequency table as given :
| Per day expense (in ₹) | Number of families (fi) | class mark (xi) | fixi |
| 25-35 | 3 | 30 | 90 |
| 35-45 | 7 | 40 | 280 |
| 45-55 | 6 | 50 | 300 |
| 55-65 | 6 | 60 | 360 |
| 65-75 | 3 | 70 | 210 |
| Total | Σfi = 25 | Σfixi = 1240 |
∴ mean = \(=\frac{\Sigma f_i x_i}{\Sigma f_i}\)
= \(\frac {1240}{25}\)
= ₹ 49.6
Hence, mean expense of families = ₹ 49.6
![]()
Question 2.
The following distribution shows the daily pocket allowance of children of a locality.
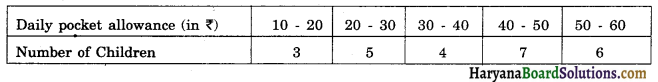
Find the mean daily pocket allowance by using appropriate method.
Solution :
| Daily pocket allowance (in ₹) | Number of children (fi) | class mark (xi) | fixi |
| 10-20 | 3 | 15 | 45 |
| 20-30 | 5 | 25 | 125 |
| 30-40 | 4 | 35 | 140 |
| 40-50 | 7 | 45 | 315 |
| 50-60 | 6 | 55 | 330 |
| Total | Σfi = 25 | Σfixi = 955 |
∴ mean = \(=\frac{\Sigma f_i x_i}{\Sigma f_i}\)
= \(\frac {955}{25}\) = ₹ 38.2
Hence, mean daily pocket allowance = ₹ 38.2
Question 3.
The marks obtained by 110 students in an examination are given below :
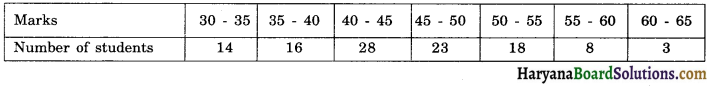
Find the mean marks of students.
Solution :
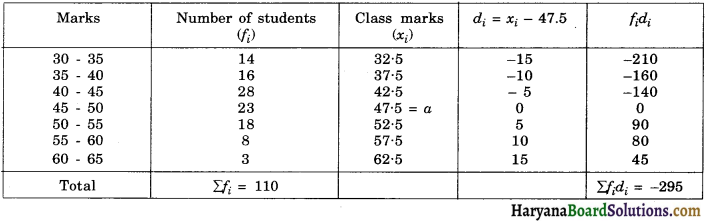
Hence, mean marks of students = 44.82
Question 4.
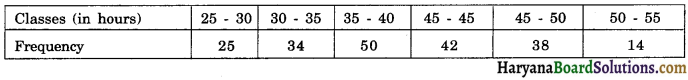
The following data gives the information on the observed life times (in hours) of 200 electrical components.
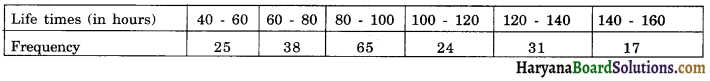
Determine the modal lifetimes of the components.
Solution :
The class interval 80 – 100 has maximum frequency. So, it is the modal class.
∴ l = 80, f1 = 65, f0 = 38, f2 = 24, h = 20
Hence, modal lifetimes of components = 87.94 hours.
![]()
Question 5.
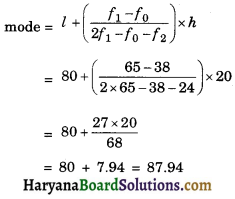
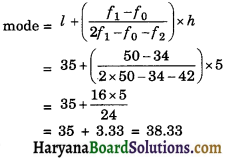
Find the mode of the following distribution.
Solution:
The class interval 35 – 40 has maximum frequency. So, it is the modal class.
∴ l = 35, f1 = 50, f0= 34, f2 = 42, h = 5
Question 6.
Find the mode of the following frequency distribution.
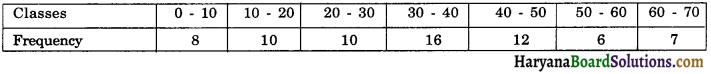
Solution :
The class interval 30 – 40 has maximum frequency. So, it is the modal class.
∴ l = 30, f1 = 16, f0 = 10, f2 = 12, h = 10
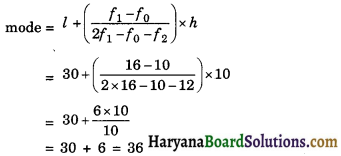
Question 7.
If the median of the following frequency distribution is 32.5. Find the values of f1 and f2.
Solution :
Let us prepare the cumulative frequency distribution table as given below.
| Class Interval | Frequency | Cumulative frequency (c.f.) |
| 0 – 10 | f1 | f1 |
| 10 – 20 | 5 | f1 + 5 |
| 20 – 30 | 9 | f1 + 14 |
| 30 – 40 | 12 | f1 + 26 |
| 40 – 50 | f2 | f1 + f2 + 26 |
| 50 – 60 | 3 | f1 + f2 + 29 |
| 60 – 70 | 2 | f1 + f2 + 31 |
| Total | n = Σfi = 40 |
Here, n = 40
⇒ fi + f2 + 31 = 40
⇒ fi + f2 = 9
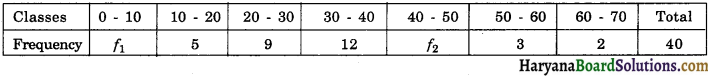
Median is 32.5, which lies in the class interval 30 – 40, So the median class is 30 – 40.
l = 30, f = 12, cf = f1 + 14, h = 10
Putting the value of f1 in equation (1), we get
3 + f2 = 9
f2 = 6
Hence, f1 = 3, f2 = 6
![]()
Question 8.
On the annual day of school agewise participation of students is given in the following distribution table.
| Age (in years) | Number of students |
| Less than 6 | 2 |
| Less than 8 | 6 |
| Less than 10 | 12 |
| Less than 12 | 22 |
| Less than 14 | 42 |
| Less than 16 | 67 |
| Less than 18 | 76 |
Find the median of students and get the median graphically.
Solution :
We convert the cumulative frequency table into depicting class intervals with their respective frequencies as given below :
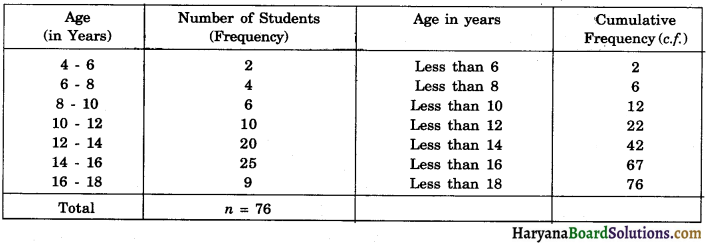
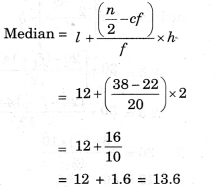
\(\frac {n}{2}\) = \(\frac {76}{2}\) = 38
But 38 comes under the cumulative frequency 42 and the class interval against cumulative frequency 42 is 12 – 14. So, it is the median class.
Here, l = 12, f = 20, cf = 22, h = 2
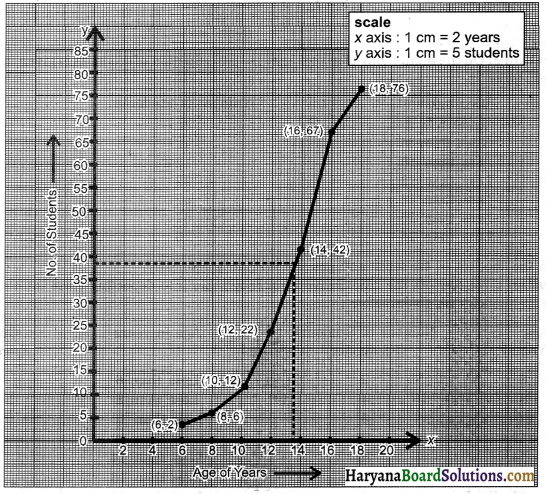
We plots the points (6, 2), (8, 6), (10, 12), (12, 22), (14, 22), (16, 67), (18, 76) on the graph paper joining these points with a free hand to get less than curve as shown in a graph. We have n = 38.
Now, locate the point on the ogive where, ordinate is 38. The n coordinate corresponding to this ordinate is 13.6. Therefore required median on the graph is 13.6.
Question 9.
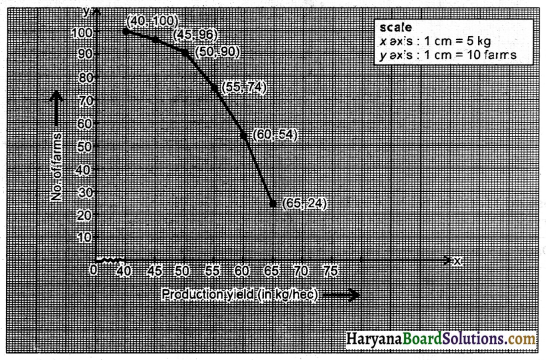
The following table gives production on yield per hectare of wheat of 100 farms of a village.
| Production Yield | Number of farms |
| 40 – 45 | 4 |
| 45 – 50 | 6 |
| 50 – 55 | 16 |
| 55 – 60 | 20 |
| 60 – 65 | 30 |
| 65 – 70 | 24 |
Change the distribution of a more than type distribution and draw its ogive.
Solution :
We prepare the cumulative frequency table by more than type method as given :
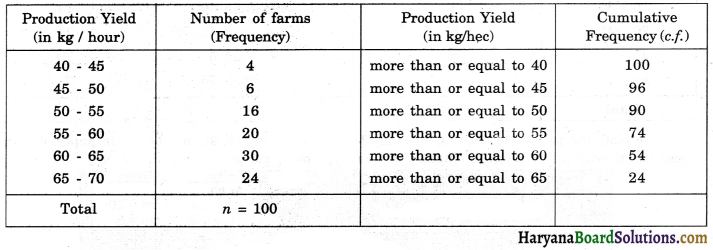
\(\frac {n}{2}\) = \(\frac {100}{2}\) = 50
We plots the points (40, 100), (45, 96), (50, 90), (55, 74), (60, 54) and (65, 24) on the graph paper. Joining these points with a free hand to obtain more than type ogive curve as shown in a graph.
![]()
Question 10.
By changing the following frequency distribution to less than type distribution, draw idts ogive.
| Classes | Number of farmers |
| 0 – 15 | 6 |
| 15 – 30 | 8 |
| 30 – 45 | 10 |
| 45 – 60 | 6 |
| 60 – 75 | 4 |
Solution :
We prepare the cumulative frequency table by less than type method as given :
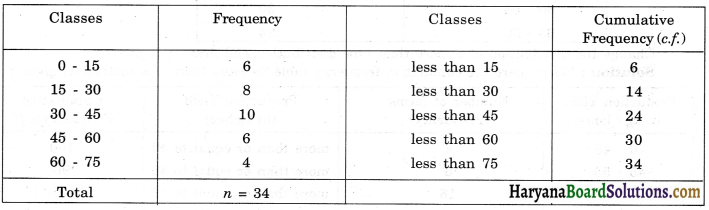
We plots the points (15, 6), (30, 14), (45, 24), (60, 30) and (75, 34) on the graph paper. Joining these points with a free hand to obtain less than type ogive curve as shown in graph.
Question 11.
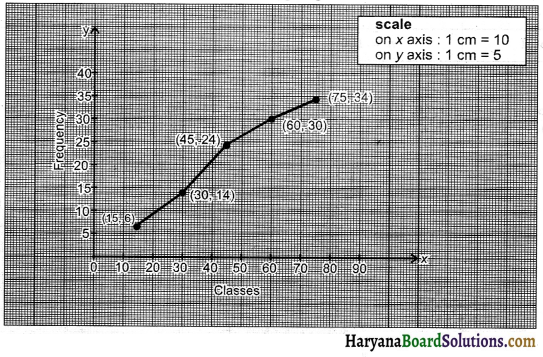
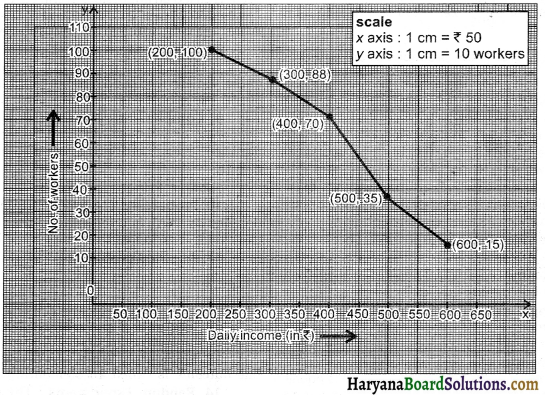
Given below is a frequency distribution table showing daily income of 100 workers of a factory.
| Daily income of workers (in ₹) | Number of Workers |
| 200 – 300 | 12 |
| 300 – 400 | 18 |
| 400 – 500 | 35 |
| 500 – 600 | 20 |
| 600 – 700 | 15 |
Convert this table to a cumulative frequency distribution table of more than type.
Solution :
We prepare the cumulative frequency table by more than type method as given :
We plots the points (200, 100), (300, 88), (400, 70), (500, 35) and (600, 15) on the graph paper. Joining these points with a free hand to obtain more than type ogive curve as shown in a graph.
Fill in the Blanks
Question 1.
The data having more than one mode is called _______ data.
Solution :
multimodal
![]()
Question 2.
The cumulative frequency table is useful in determining the _______ .
Solution :
median
Question 3.
Each group into which the raw data is condensed is called a _______ .
Solution :
class interval
Question 4.
The ______ between the true upper limit and true lower point of a class is called its class size.
Solution :
difference
Question 5.
_______ of observation is the sum of the values of all the observations divided by the total number of observations.
Solution :
mean
Question 6.
The _______ frequency of a class is the frequency obtained by adding the frequency of all classes preceding the given class.
Solution :
cumulative
![]()
Question 7.
The data having only one mode is called _____ data.
Solution :
Unimodal
Multiple Choice Questions
Choose the correct answer each of the following:
Question 1.
If xis are the midpoints of the class intervals of grouped data, fis are the corresponding frequencies and \(\bar{x}\) is the mean, then Σ(fixi – \(\bar{x}\)) is equal :
(a) 0
(b) – 1
(c) 1
(d) 2
Solution :
(a) 0
We know that the mean of the data is given by
\(\bar{x}\) = \(\frac{Σfixi}{x}\)
where n = Σfi
∴ Σ(fixi – \(\bar{x}\)) = Σfixi – Σ\(\bar{x}\)
= n\(\bar{x}\) – n\(\bar{x}\)
= 0 [∵ x\(\bar{i}\) = n\(\bar{x}\)]
Hence, correct choice is (a).
![]()
Question 2.
If the mode of a data is 18 and mean is 24, then median is
(a) 18
(b) 24
(c) 22
(d) 21
Solution :
(c) 22
mode = 18, mean = 24,
∵ 3 median = mode + 2 mean
= 18 + 2 (24)
= 18 + 48 = 66
∴ median = \(\frac {66}{3}\) = 22
Hence, correct choice is (c).
Question 3.
Mode of data 2, 3, 5, 2, 3, 6, 5, 2, 2, 5, 7, 4, 4, is:
(a) 5
(b) 3
(c) 2
(d) 4
Solution :
(c) 2
Here frequency of 2 is 4 so mode = 2.
Hence, correct choice is (c).
Question 4.
For the following distribution :
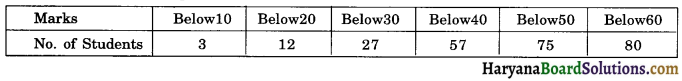
The modal class is:
(a) 10-20
(b) 20-30
(c) 30-40
(d) 50-60
Solution :
(c) 30-40
| Marks | Number of students | CF |
| Below 10 | 3 = 3 | 3 |
| 10 – 20 | 12 – 3 = 9 | 12 |
| 20 – 30 | 27 – 12 = 15 | 27 |
| 30 – 40 | 57 – 27 = 30 | 57 |
| 40 – 50 | 75 – 57 = 18 | 75 |
| 50 – 60 | 80 – 75 = 5 | 80 |
Here the heighest frequency is 30, which likes in the interval 30 – 40.
Hence correct choice is (c).
![]()
Question 5.
In an arranged discrete series in which total number of observations n is even, median is:
(a) (\(\frac {n}{2}\))th terms
(b) (\(\frac {n}{2}\) + 1)th terms
(c) The mean of (\(\frac {n}{2}\))th term and (\(\frac {n}{2}\) + 1)th term
(d) none of these
Solution :
(c) The mean of (\(\frac {n}{2}\))th term and (\(\frac {n}{2}\) + 1)th term
When n is even then median
The mean of (\(\frac {n}{2}\))th term and (\(\frac {n}{2}\) + 1)th term
So correct choice is (c).
Question 6.
While computing mean of grouped data, we assume that the frequencies are :
(a) evenly distributed over all the classes
(b) centred at the class marks of the classes
(c) centred at the upper limits of the classes
(d) centred at the lower limits of the classes
Solution :
(b) centred at the class marks of the classes
In computing the mean of grouped data, the frequencies are centered at the class marks of the classes.
Hence, the option (b) is correct.
Question 7.
The cumulative frequency table is useful in determining the:
(a) mean
(b) median
(c) mode
(d) all of these
Solution :
(b) median
![]()
Question 8.
For the following distribution :
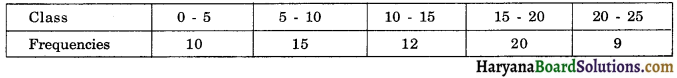
The sum of lower limits of the median class and modal class is:
(a) 15
(b) 25
(c) 30
(d) 35
Solution :
(b) 25
| Class | Frequency | CF |
| 0 – 5 | 10 | 10 |
| 5 – 10 | 15 | 24 |
| 10 – 15 | 12 | 37 |
| 15 – 20 | 20 | 57 |
| 20 – 25 | 9 | 66 |
Now \(\frac {N}{2}\) = \(\frac {66}{2}\) = 33
Which lies in the interval 10 – 15.
Therefore lower limit of the median class is 10.
The highest frequency is 20, which lies in the interval 15 – 20, therefore lower limit of modal class is 15. Hence required sum is 10 + 15 = 25.
Hence correct choice is (b).